Higher and foundation tiers
Calculating the rate of a chemical reaction often involves a bit of graph work. Remember when working out the rate of a reaction you will be calculating how quickly one of the reactants is used up or how quickly one of the products appears. Most of the time the rate of a reaction is calculated by simply measuring how quickly a gas is produced or how long a particular colour change takes to happen.
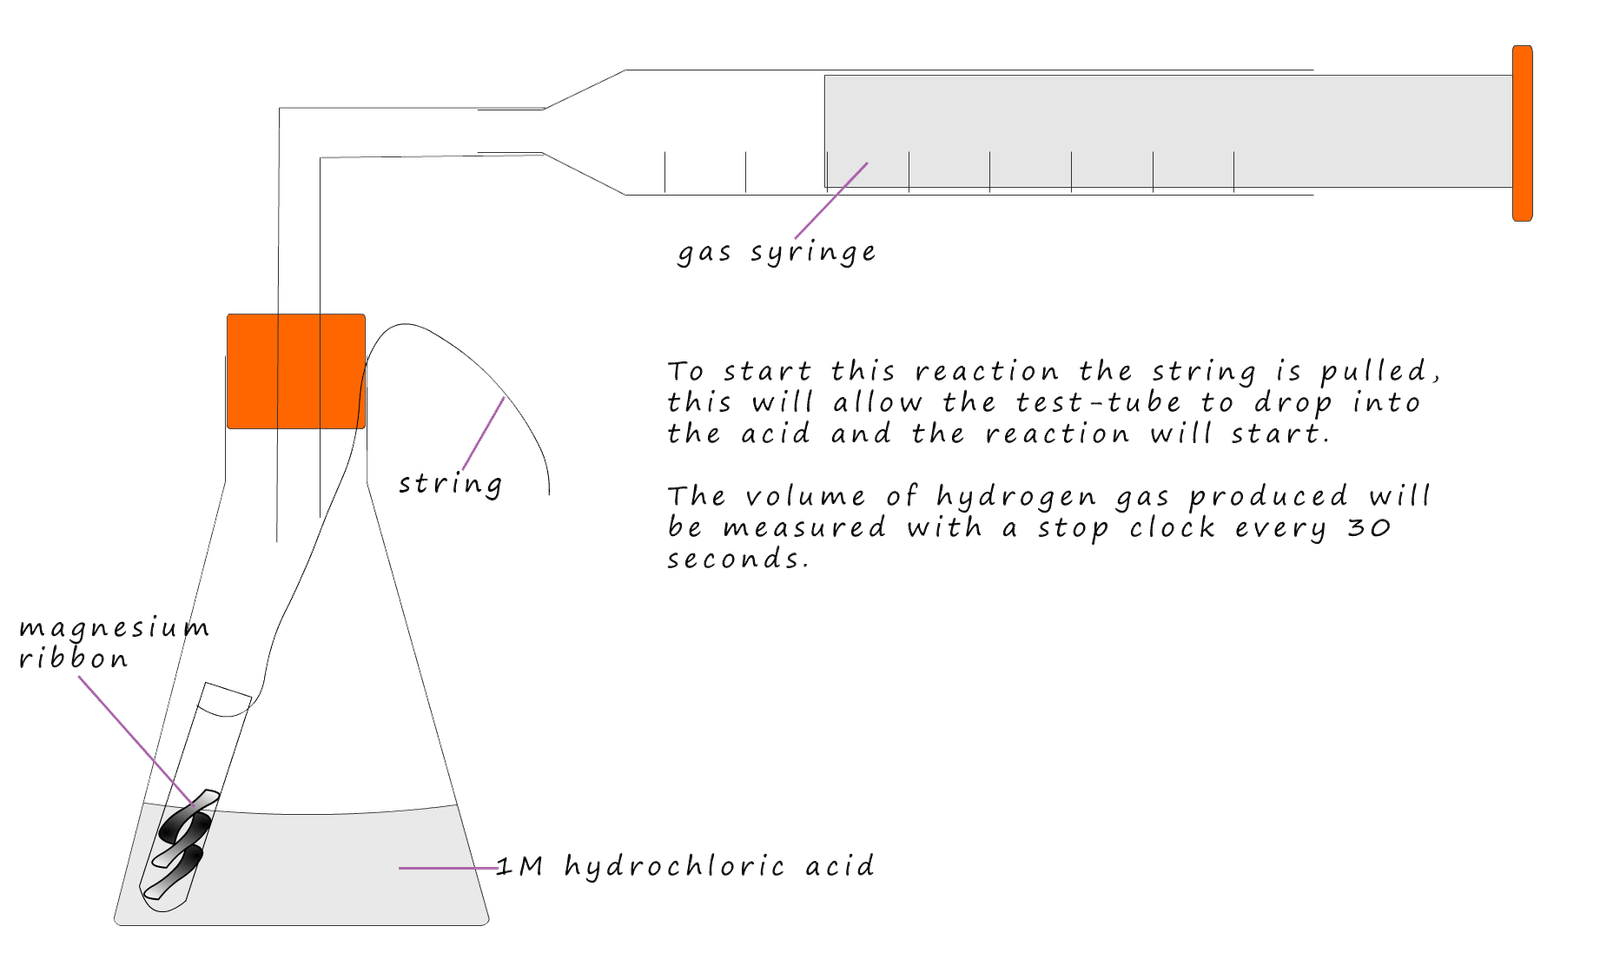
The student carrying out this reaction will measure the rate of this reaction by measuring the volume of hydrogen gas collected in the gas syringe every 30 seconds until the reaction stops. The acid is in excess; this will make sure all the magnesium ribbon reacts and none is left over. The apparatus used is shown below.

The results from the experiment are shown below:
| Time/s | 0 | 30 | 60 | 90 | 120 | 150 | 180 | 210 |
|---|---|---|---|---|---|---|---|---|
| volume of gas/ml | 0 | 14 | 25 | 32 | 37 | 39 | 40 | 40 |
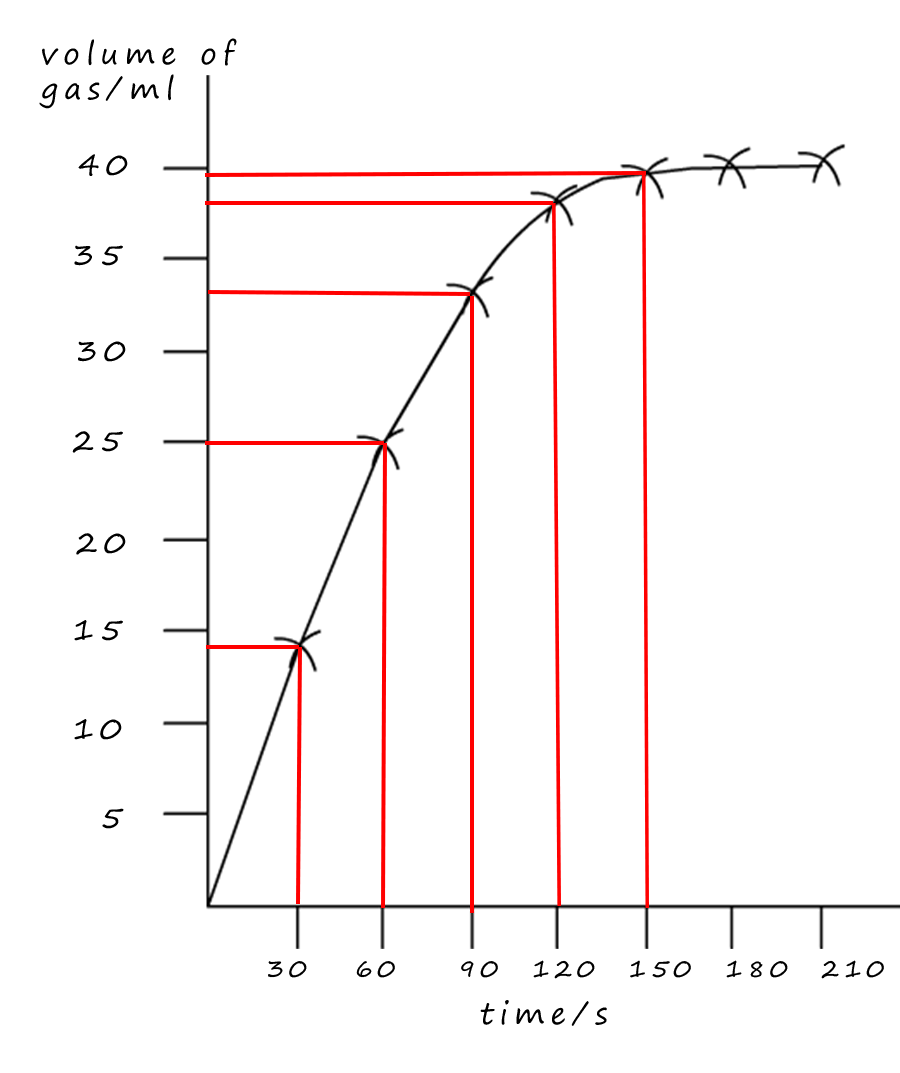
 Now the gradient or steepness of the graph gives an indication of the rate of the reaction taking place.The graph opposite shows the results of the experiment.
To begin with the rate of reaction is fast because there are lots of reactant particles available to react and form
the products. However as time passes the gradient of the graph becomes shallower which means the
rate of
production of hydrogen gas is falling. The graph levels or flattens off at a time of 175 seconds. This means the reaction has stopped;
no more hydrogen gas is being released and the reaction has finished. Over the 175 seconds that the
reaction took to finish we can see from the results table that 40
ml of hydrogen gas was released.
You can see that the graph slope or gradient is steep to begin with but gradually the slope
decreases; this means that the volume of hydrogen gas released every 30s is decreasing, or we can say that the rate of reaction is decreasing.
So volume of gas released was 40ml or 40cm3 and the time taken was 175s
Rate= 40ml ÷ 175s = 0.23 ml/s
0.23ml of gas was released on average every second.
Note: to get the units for rate you just divide the units for volume and time.
That is ml÷ s, or ml/s, which reads as ml per second
2. To calculate the rate of production of hydrogen gas between two given times you carry out a similar
calculation
e.g.2- What was the average rate of reaction in the first 30s?
So from the graph at a time of 30s the volume of hydrogen gas released was 14ml.
So between 0 and 30 seconds 14ml of hydrogen gas was released. So to calculate the rate of reaction use the
same formula as above:
 3. Calculating instantaneous rate of reaction; that is the rate of reaction at one point or time in the reaction.
To calculate the rate at any one particular point or time you need to draw a tangent to the line at that point.
e.g.3 - What was the rate of reaction at a time of 120s?
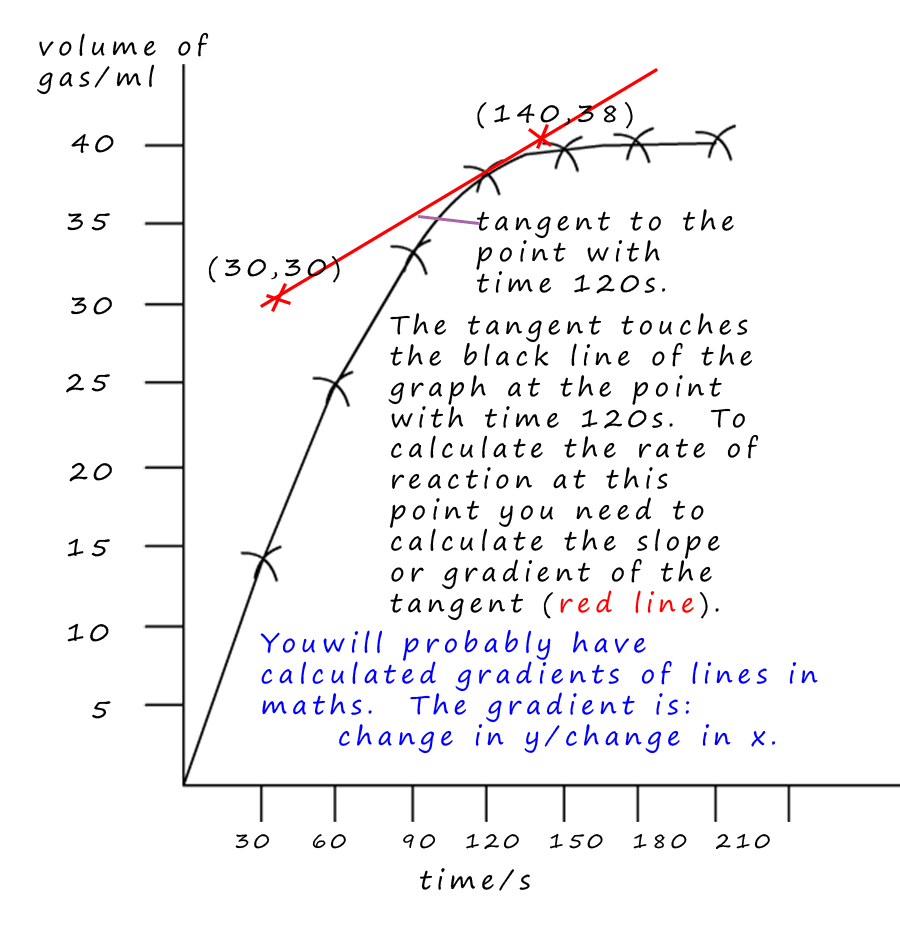
To calculate the rate of the reaction at a time of 120s- draw a tangent to the graph at time=120s.
The tangent line should touch the curve but never cross it; when drawing the tangent try to get an equal area either side of the
tangent line and the line of the graph, the tangent should also have the same slope as the graph at that particular point. Then draw the tangent line using a ruler. I have marked 2 points which are on the tangent, the
points (30, 30) and (140, 38).
The two y co-ordinates from these points are 38 and 30. The two x co-ordinates are (140 and 30).
The gradient is worked out by the following method:
Gradient= change in y ÷ change in x
Change in y = (38-30) = 8
Change in x= (140-30) = 110
So the gradient is = 8 ÷ 110 = 0.07ml/s. Not very fast at all, the reaction has almost finished at this point!!!